Note
Go to the end to download the full example code
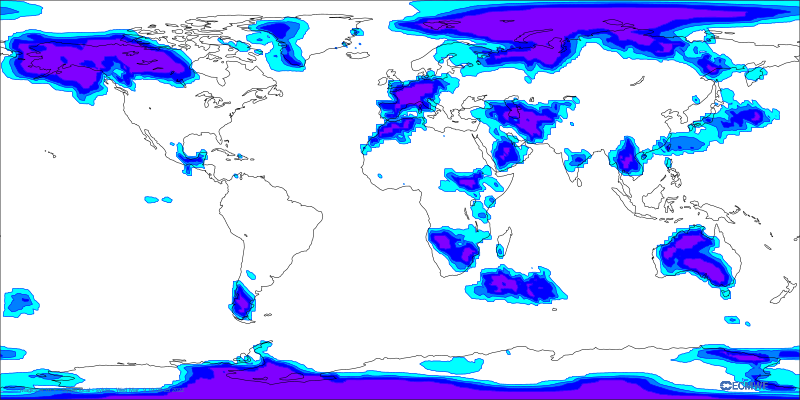
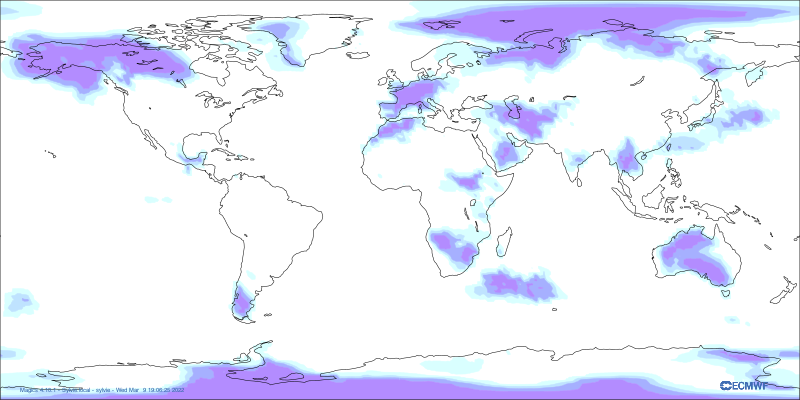
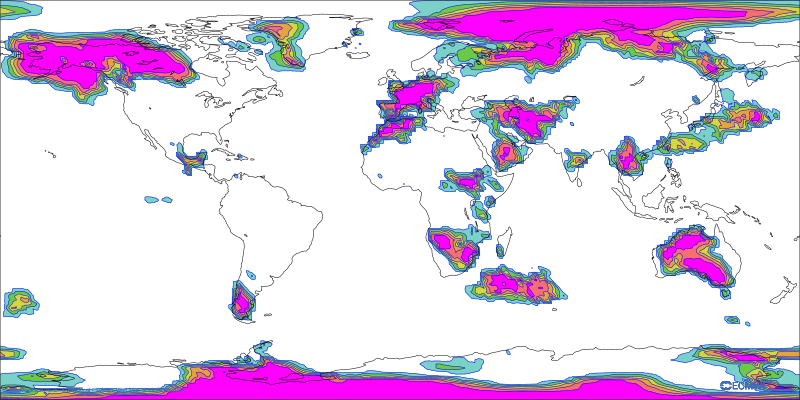
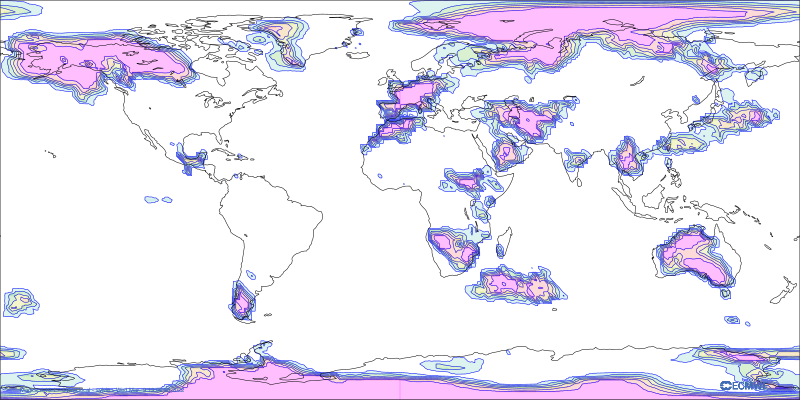
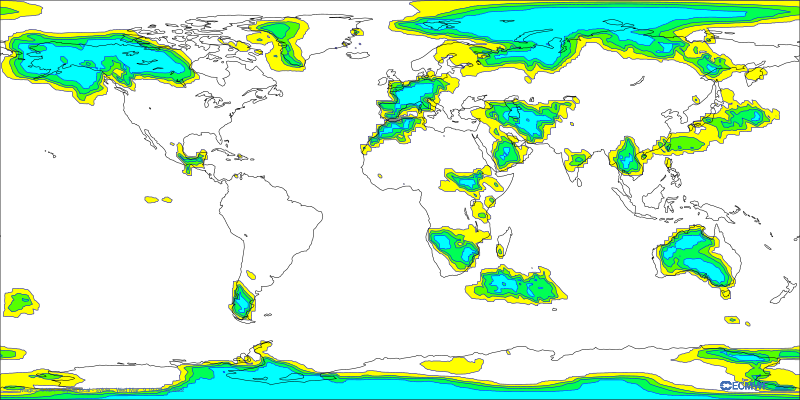
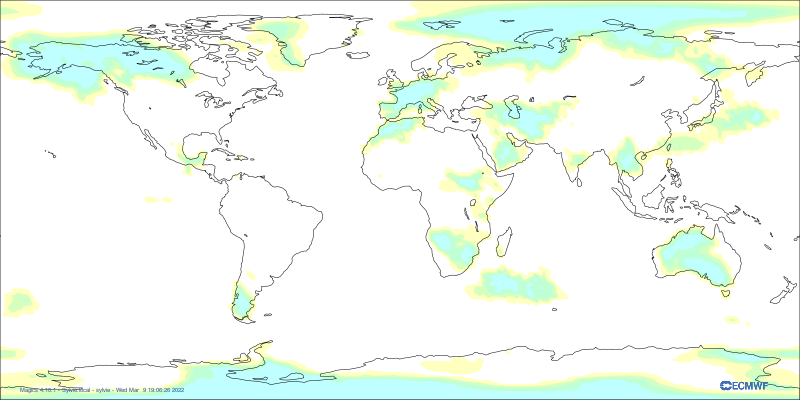
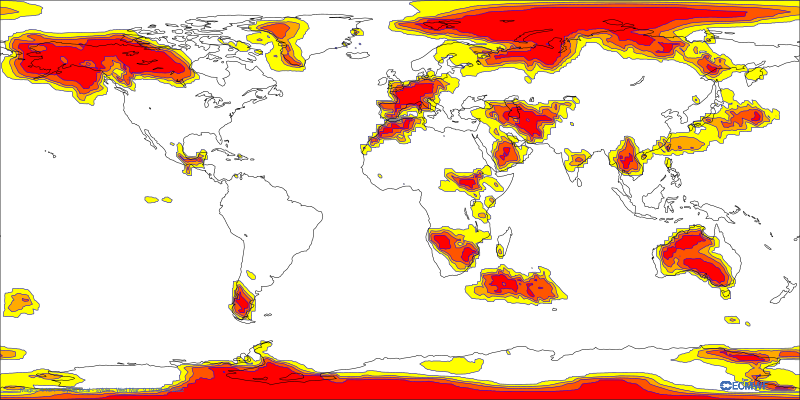
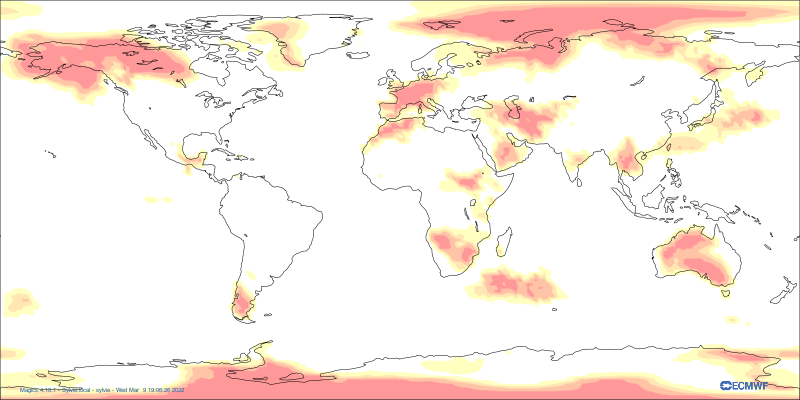
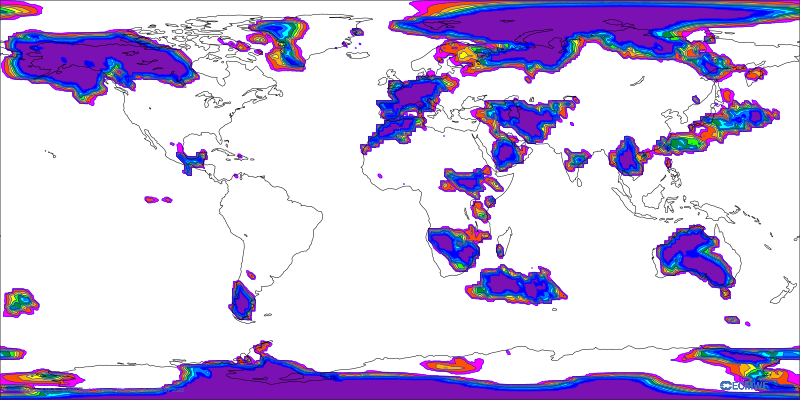
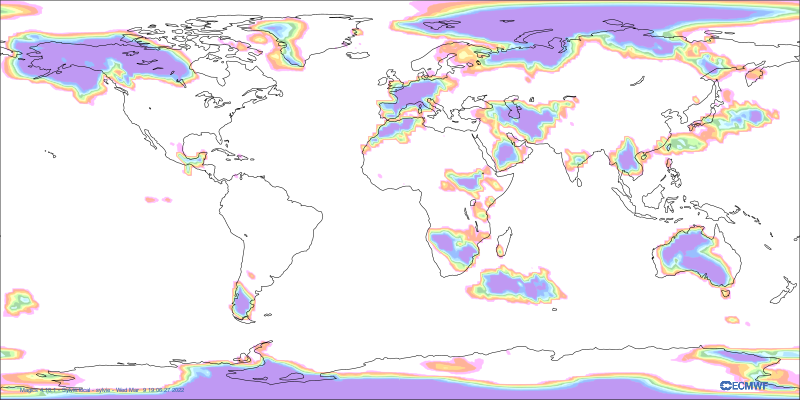
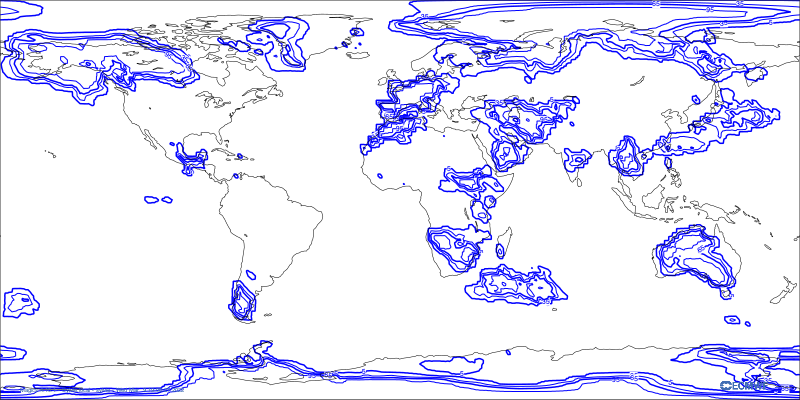
2m temperature anomaly of at least +2K
The metadata used to detect the styles are :
paramId |
131001 |
shortName |
2tag2 |
type |
ep |
Default style:
Contour shade (0-100%, blue-purple) [sh_blup_f0t100lst]
Other available styles:
Contour shade (0-100%, blue-purple) [sh_blup_f0t100lst]
Contour shade (0-100%, light blue-purple) [sh_blup_f0t100lst_light]
Contour shade (5-100%, more levels) [sh_rgb_f5t100]
Contour shade (5-100%, transparent, more levels) [sh_rgb_transparent_f5t100]
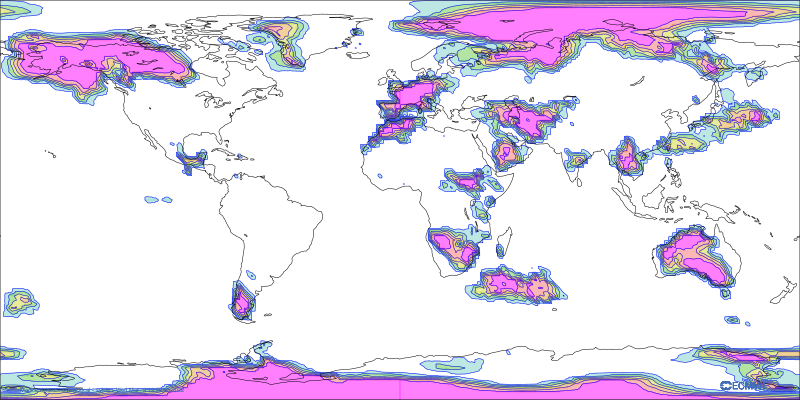
Contour shade (5-100%, More transparent, more levels) [sh_rgb_transparent25_f5t100]
Contour shade (0-100%, green) [sh_grn_f0t100lst]
Contour shade (0-100%, light green) [sh_grn_f0t100lst_light]
Contour shade (0-100%, red) [sh_red_f0t100lst]
Contour shade (0-100%, light red) [sh_red_f0t100lst_light]
Contour shade (0-100%, every 10%) [genesis_prob]
Contour shade (0-100%, every 10%) [genesis_prob_light]
Black contours for probabilities (thickness 2) [ct_prob_black_f5t100t2]
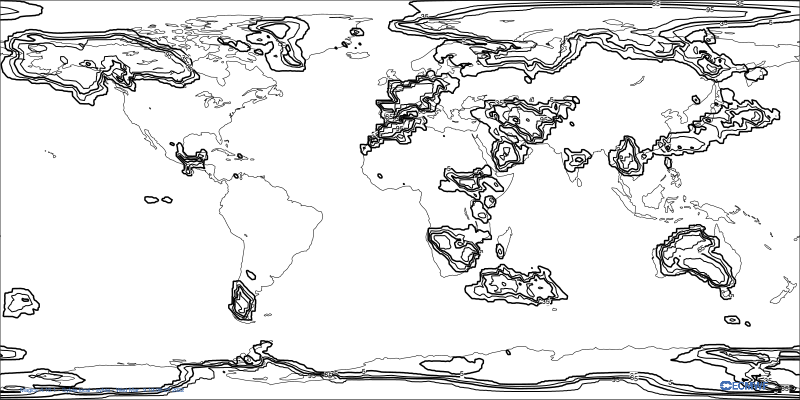
Blue contours for probabilities (thickness 2) [ct_prob_blue_f5t100t2]
from Magics import macro as magics

output = magics.output(output_formats = ['png'],
                output_name_first_page_number = "off",
                output_name = "2tag2")


data =  magics.mgrib(grib_input_file_name = "2tag2.grib")

contour = magics.mcont(contour_automatic_setting="style_name",
                        contour_style_name= "sh_blup_f0t100lst",)

coastlines = magics.mcoast(map_grid = "off" )

magics.plot(output, data, contour, coastlines)

# sphinx_gallery_thumbnail_path = '_static/styles/2tag2-sh_blup_f0t100lst.png'
Total running time of the script: ( 0 minutes 0.000 seconds)